Chinese
 English


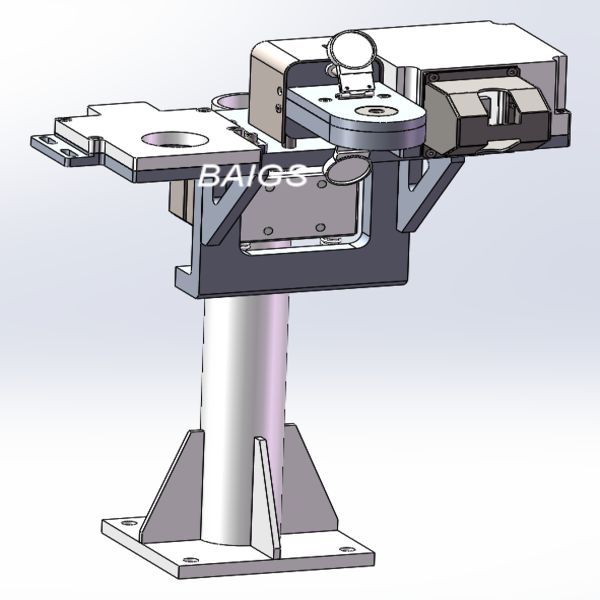
Spot Welding Equipment Predictive Maintenance Monitoring System
It can realize real-time monitoring of welding equipment status, including the state of electrode cap after
grinding, the center offset of electrode cap, static current and servo motor pressure, provide accurate
welding quality prediction, as well as targeted equipment preventive maintenance guidance。
Product Feature:
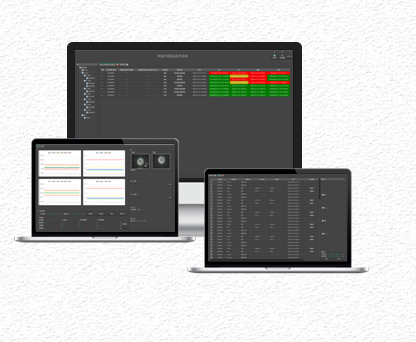
1.Timely warning and feedback on the detection status of welding equipment.
2.Promote maintenance and repair to reduce and avoid the occurrence and overflow of welding defects.
3. Improve the quality of solder joints and reduce the frequency of online inspection and rework of quality
gates.
4. The system supports simultaneous online testing of multiple welding equipment.
5. The system has fast response speed and stable and reliable performance.
6. The data display is rich and intuitive, and historical detection data can be accessed at any time.